
In the first week of March, LinuxTips, together with Jefferson, organized a 100% free online event about DevOps and everything that surrounds this area: the DevOps Week.
The event featured talks from several professionals, and on the first day Jefferson presented about the IT professional in the Cloud Native era.
On the second day, he talked about how to build infrastructure with Linux and Terraform. At one point in the talk, he mentioned how old-school system administrators (sysadmins) mastered many troubleshooting tools — and that, if you didn’t know strace, you weren’t a “real Sysadmin.”
He didn’t say exactly that… but that’s how I felt 😅
At the moment, I caught myself thinking about how little I’d used this tool throughout my career. And, like a great teacher, he gave a brief introduction to strace, showing how powerful it can be to understand what’s happening with a process.
After the talk, I opened a terminal and ran strace. And then I understood why I had never used it so much.
The output is extremely verbose. It’s the kind of tool that requires practice — and a good understanding of how the operating system works — to really extract value.
Shortly after, I remembered a conversation between Fábio Akita and Mano Dayvin about creating things with AI and the so-called vibe coding. It’s worth checking out their chat, The Farce Is Over: Akita, Montano and Deyvin admitted they are vibe coders
And then the idea came:
If the dev bubble only talks about AI, why not use the same approach to better learn strace — and, at the same time, explore and learn the process of building a tool from scratch?
stracectl?
Why stracectl?
Following the pattern of many tools written in Go that use ctl in the name (kubectl, etcdctl, consulctl, etc.), stracectl is an attempt to make using strace more approachable.
strace is powerful — but the user experience doesn’t help. You receive a huge amount of information, with little structure, and you need some effort and knowledge of both the operating system and the monitored process to turn the output into understanding.
The proposal of stracectl is simple:
turn a raw stream of syscalls, processes and threads into something friendly.
A Go wrapper that runs strace and transforms its output into something more readable, organized and user-friendly.
The project
Development started with the goal of creating a simple wrapper for strace, and a TUI (Text User Interface) to view syscalls and processes more pleasantly than traditional strace.
But, remembering Jefferson’s talks about Cloud Native and infrastructure, I started thinking about how I could use stracectl to analyze applications running on Kubernetes.
Then the sidecar mode idea came up, where stracectl runs as an auxiliary container, collecting data and exposing it via an HTTP API — and the web dashboard naturally became part of the project.
The project grew many features, but the central idea has always been the same: make strace more accessible and useful, especially for those who don’t have much experience with it.
Thus came the idea of creating a website with documentation and examples of how to use stracectl in different scenarios, from local use to analyzing containers as a sidecar inside a Kubernetes cluster.
So the project became a small ecosystem:
- An interactive TUI (htop-like) to explore syscalls in real time
- A HTTP sidecar mode, designed for Kubernetes
- A site with documentation and examples
- A very comprehensive README, which works almost like a learning guide
- Documented workflows (live tracing, attach, replay, sidecar, etc.)
During development, I realized that building the tool isn’t enough. It’s also necessary to create a learning experience, clear documentation, and practical examples so people can actually use stracectl and understand the value it brings.
How it works
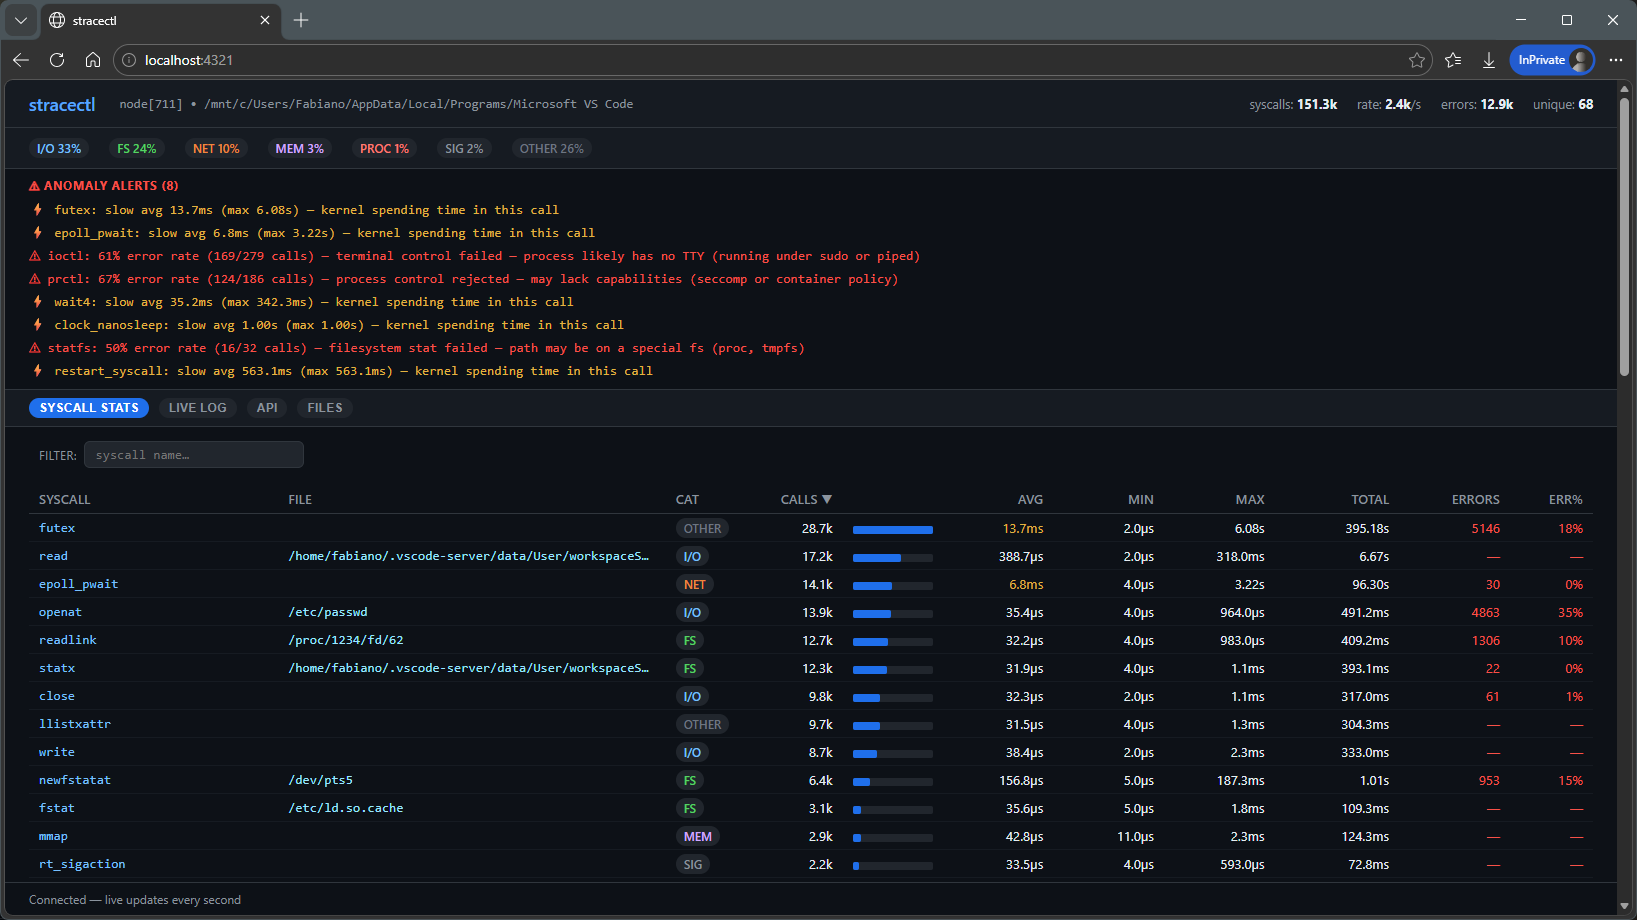
Instead of showing each syscall or running process in isolation, stracectl performs runtime aggregations, showing:
- How many times each syscall was called
- How long they take (latency)
- Error rate
- Classification by category (I/O, FS, NET, MEM, PROC)
All of this appears in an interactive dashboard, where you can navigate, sort and open details.
The idea is to move from:
“a giant unreadable log”
to:
“a map of the process behavior”
From here it’s worth exploring each part of stracectl more calmly. I’ll leave a brief summary, but you can check the full documentation on the project’s website — there are more visual examples and well-explained workflows.
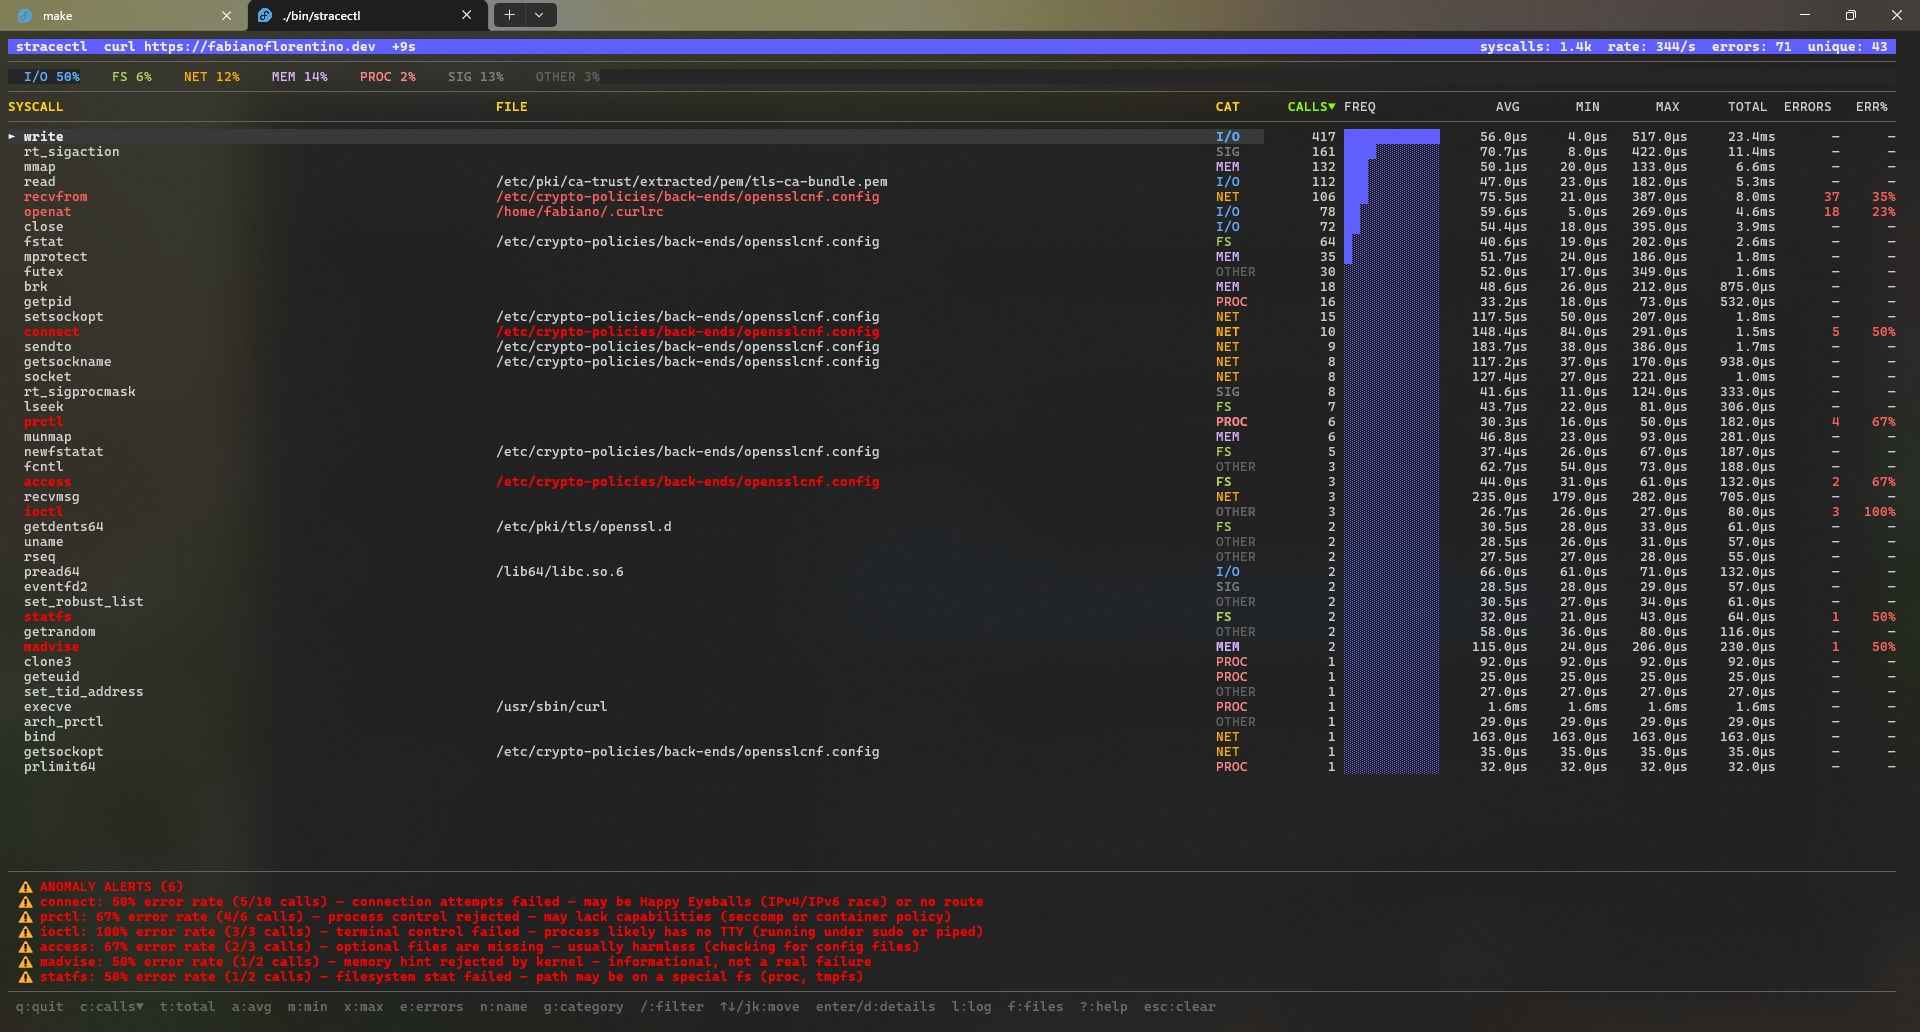
Interactive TUI
The terminal interface is probably the first contact with stracectl.
It works like an “htop for syscalls”, allowing you to navigate, sort and open details in real time.
Main screen:
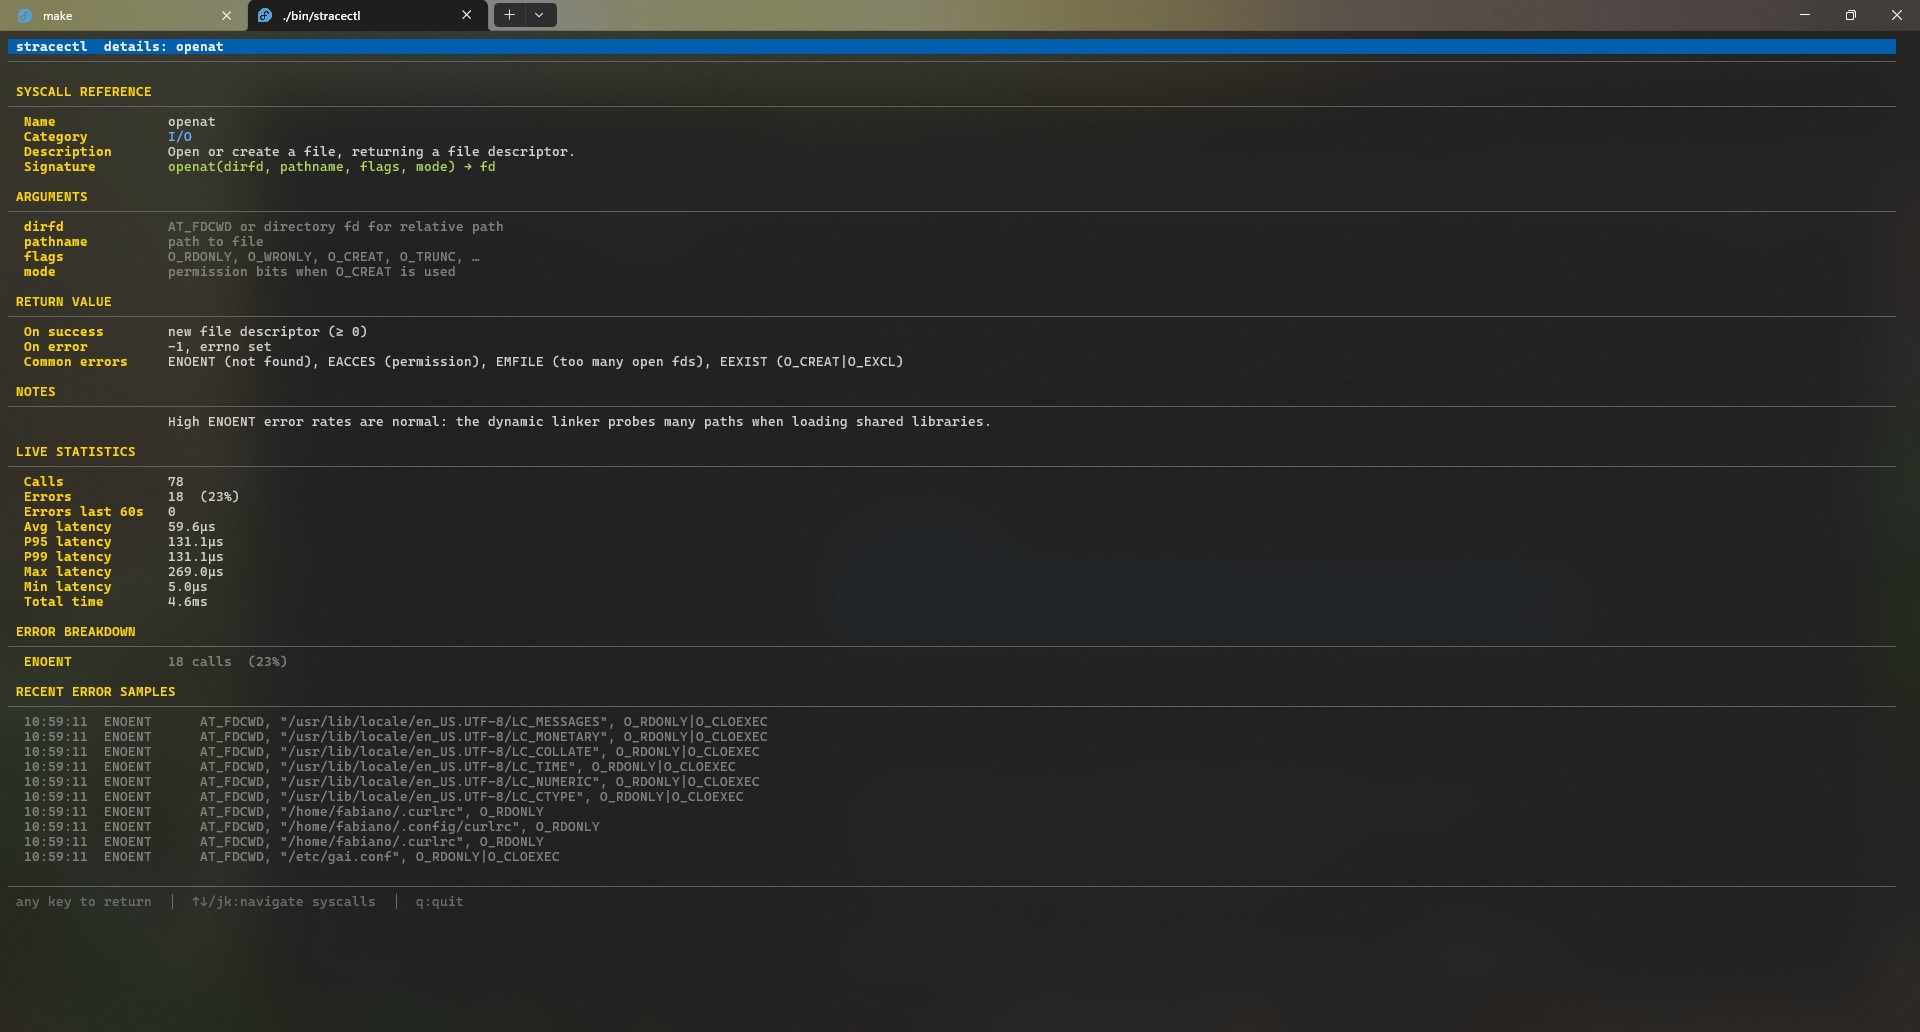
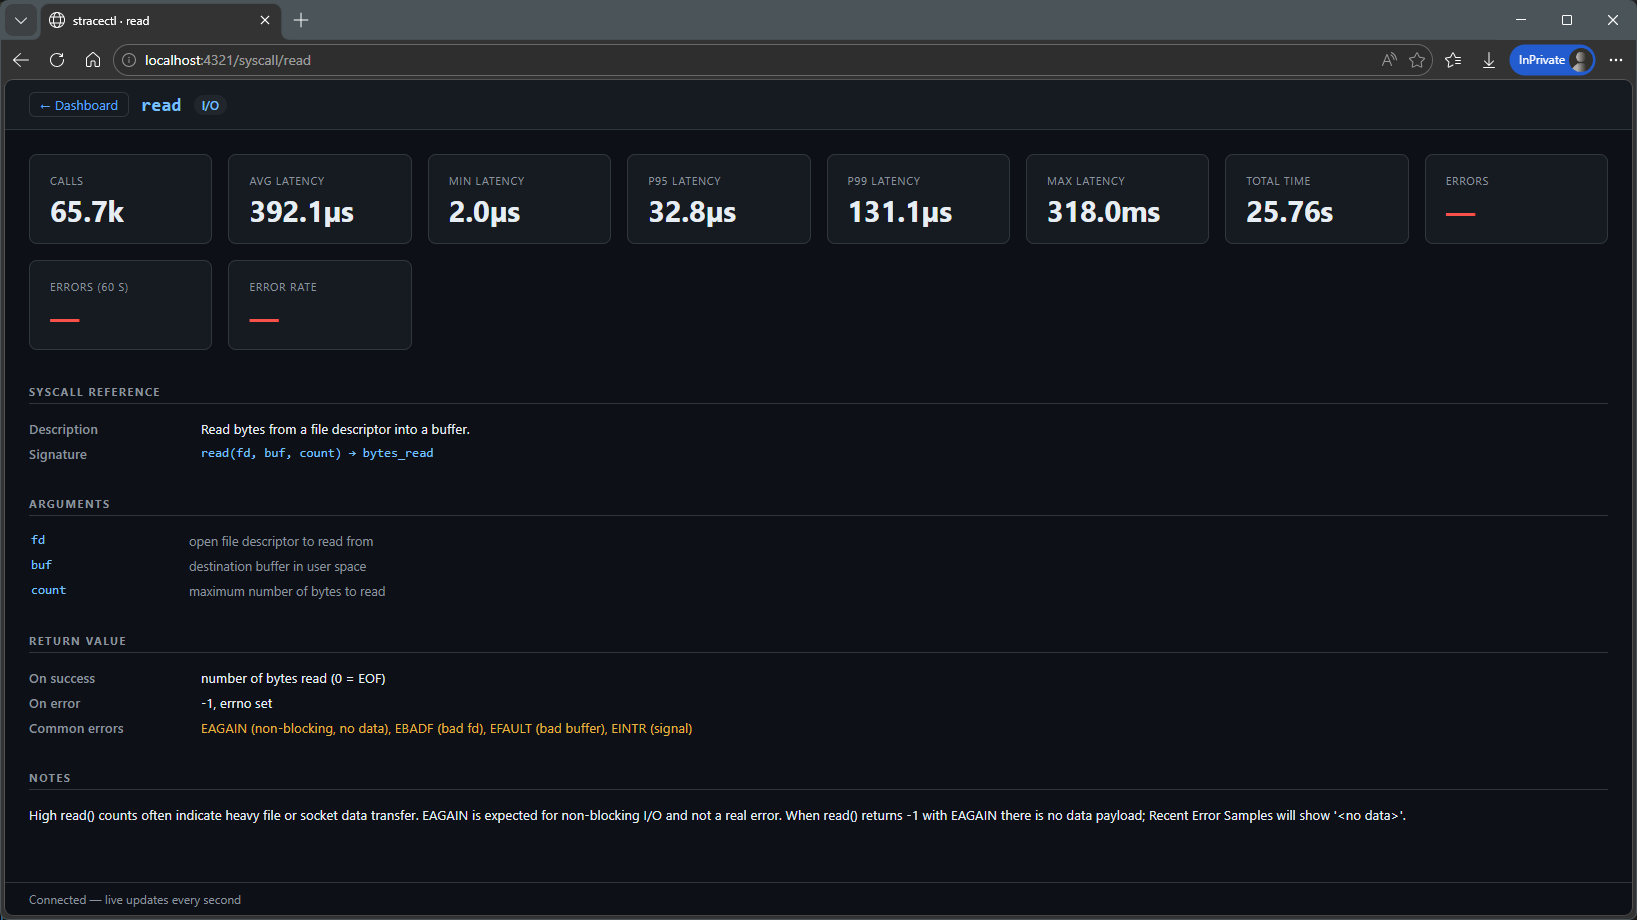
Details:
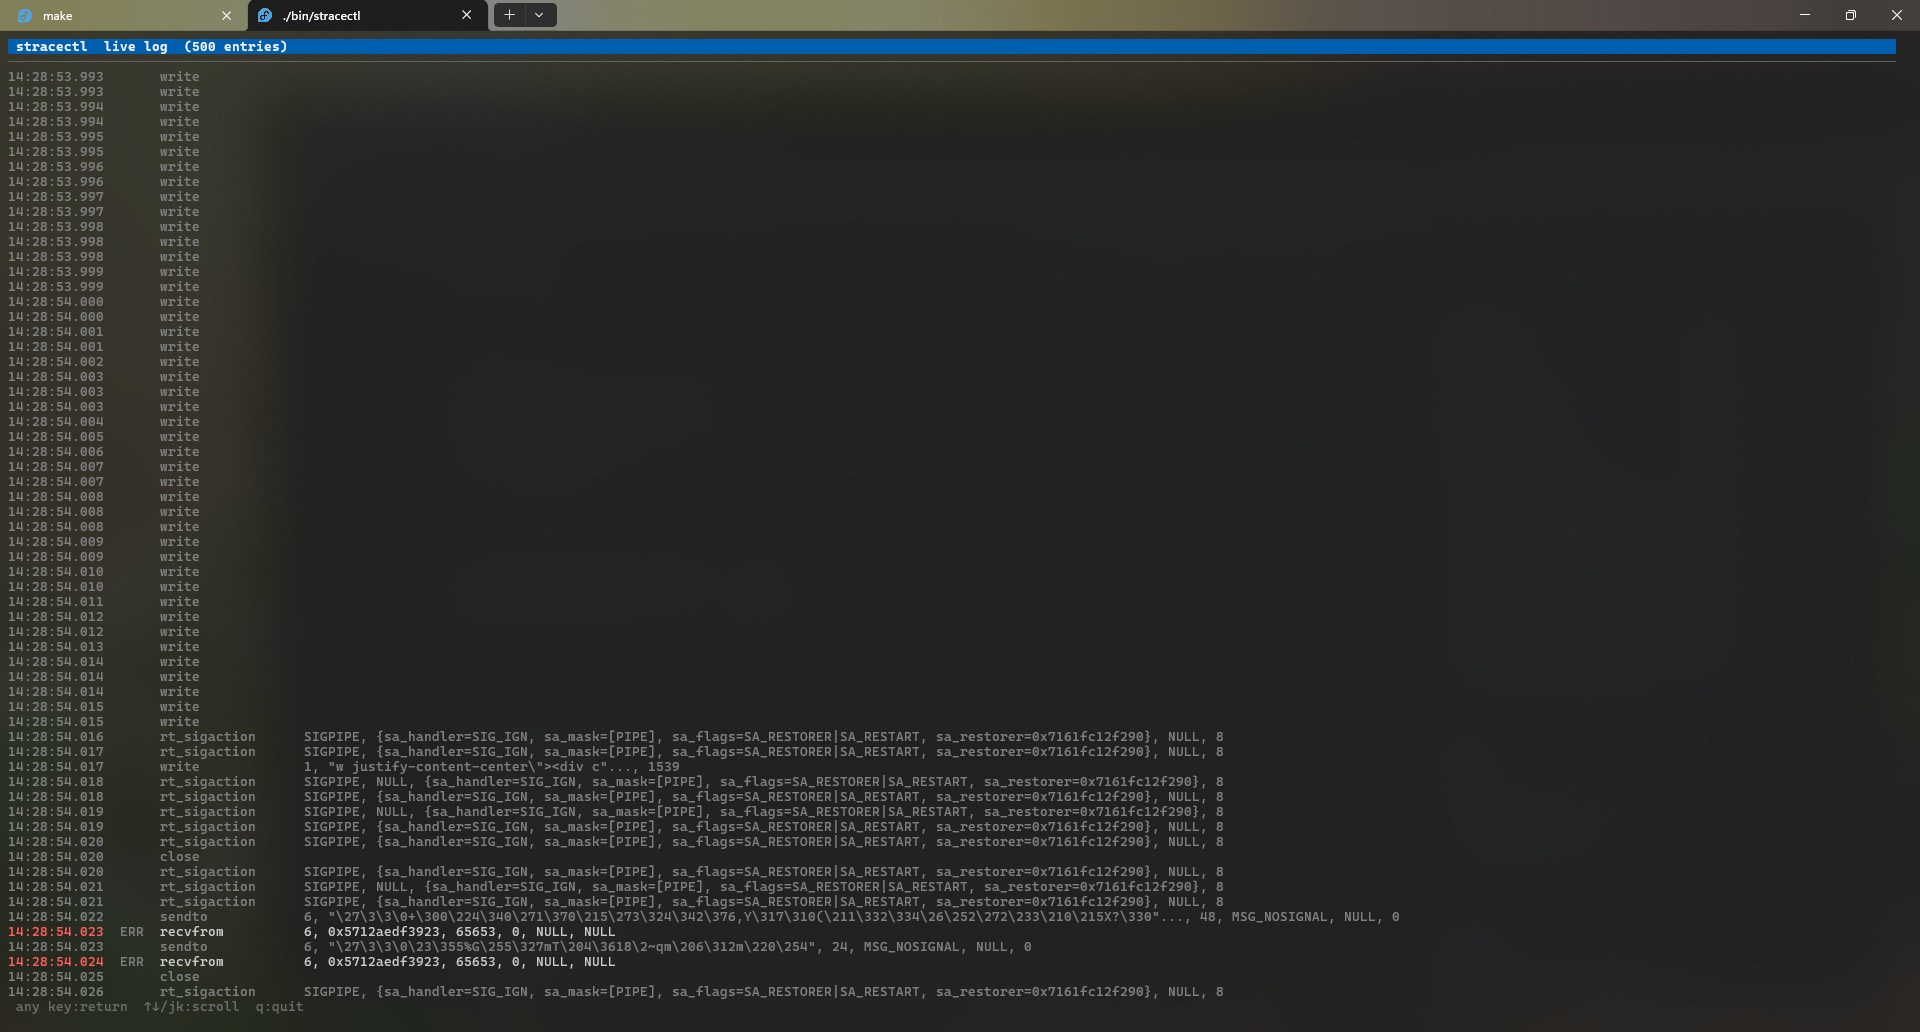
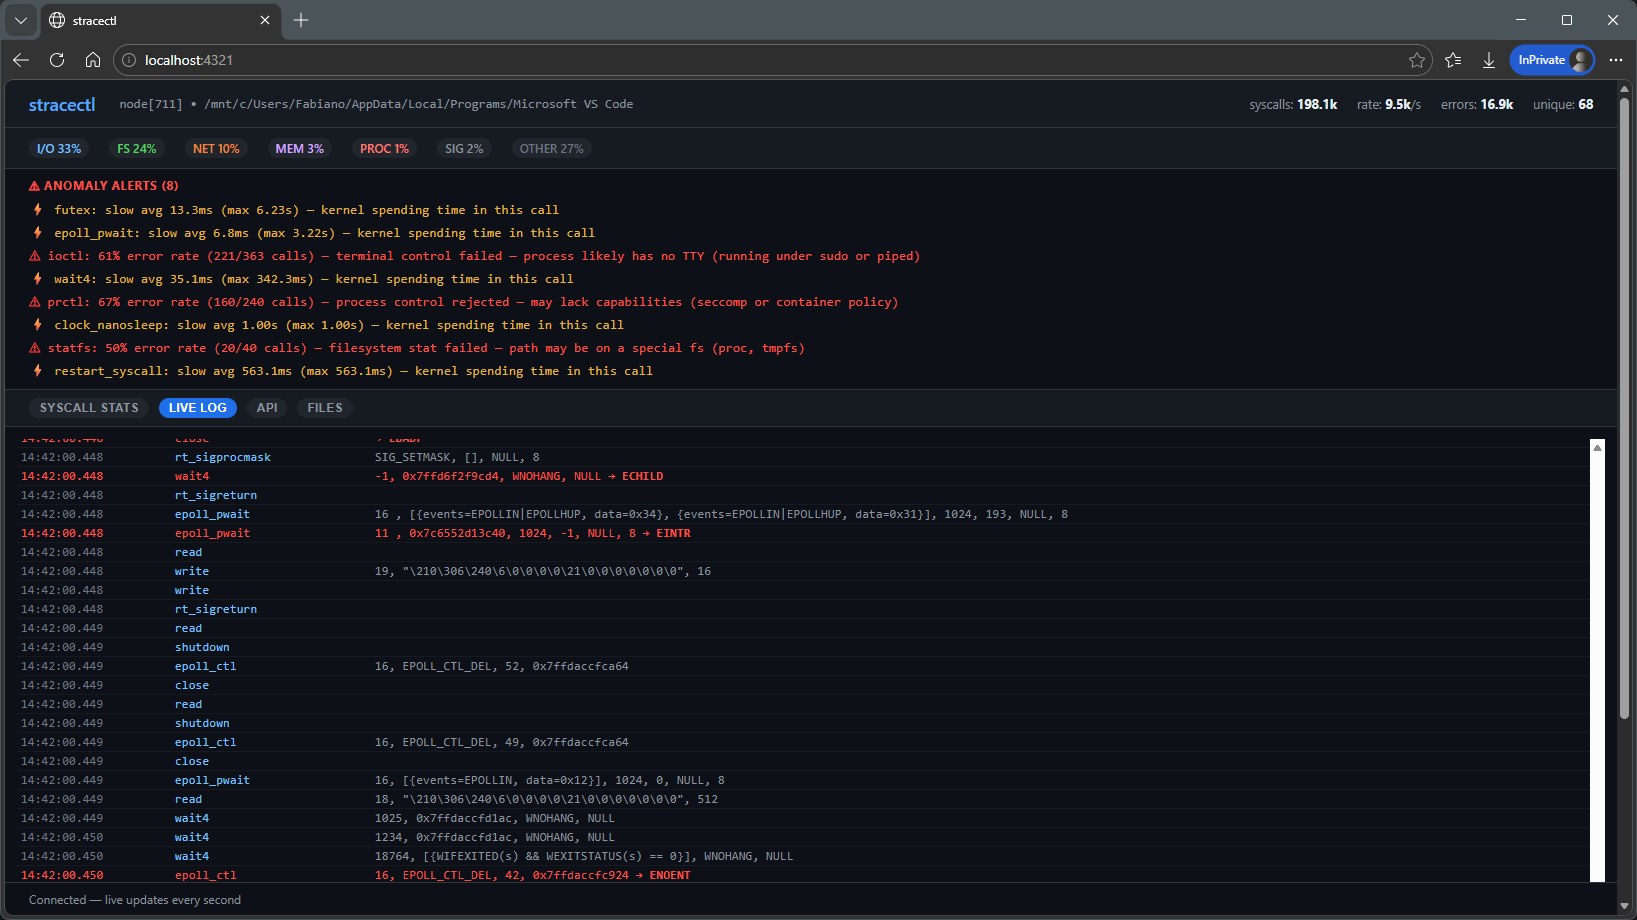
Logs:
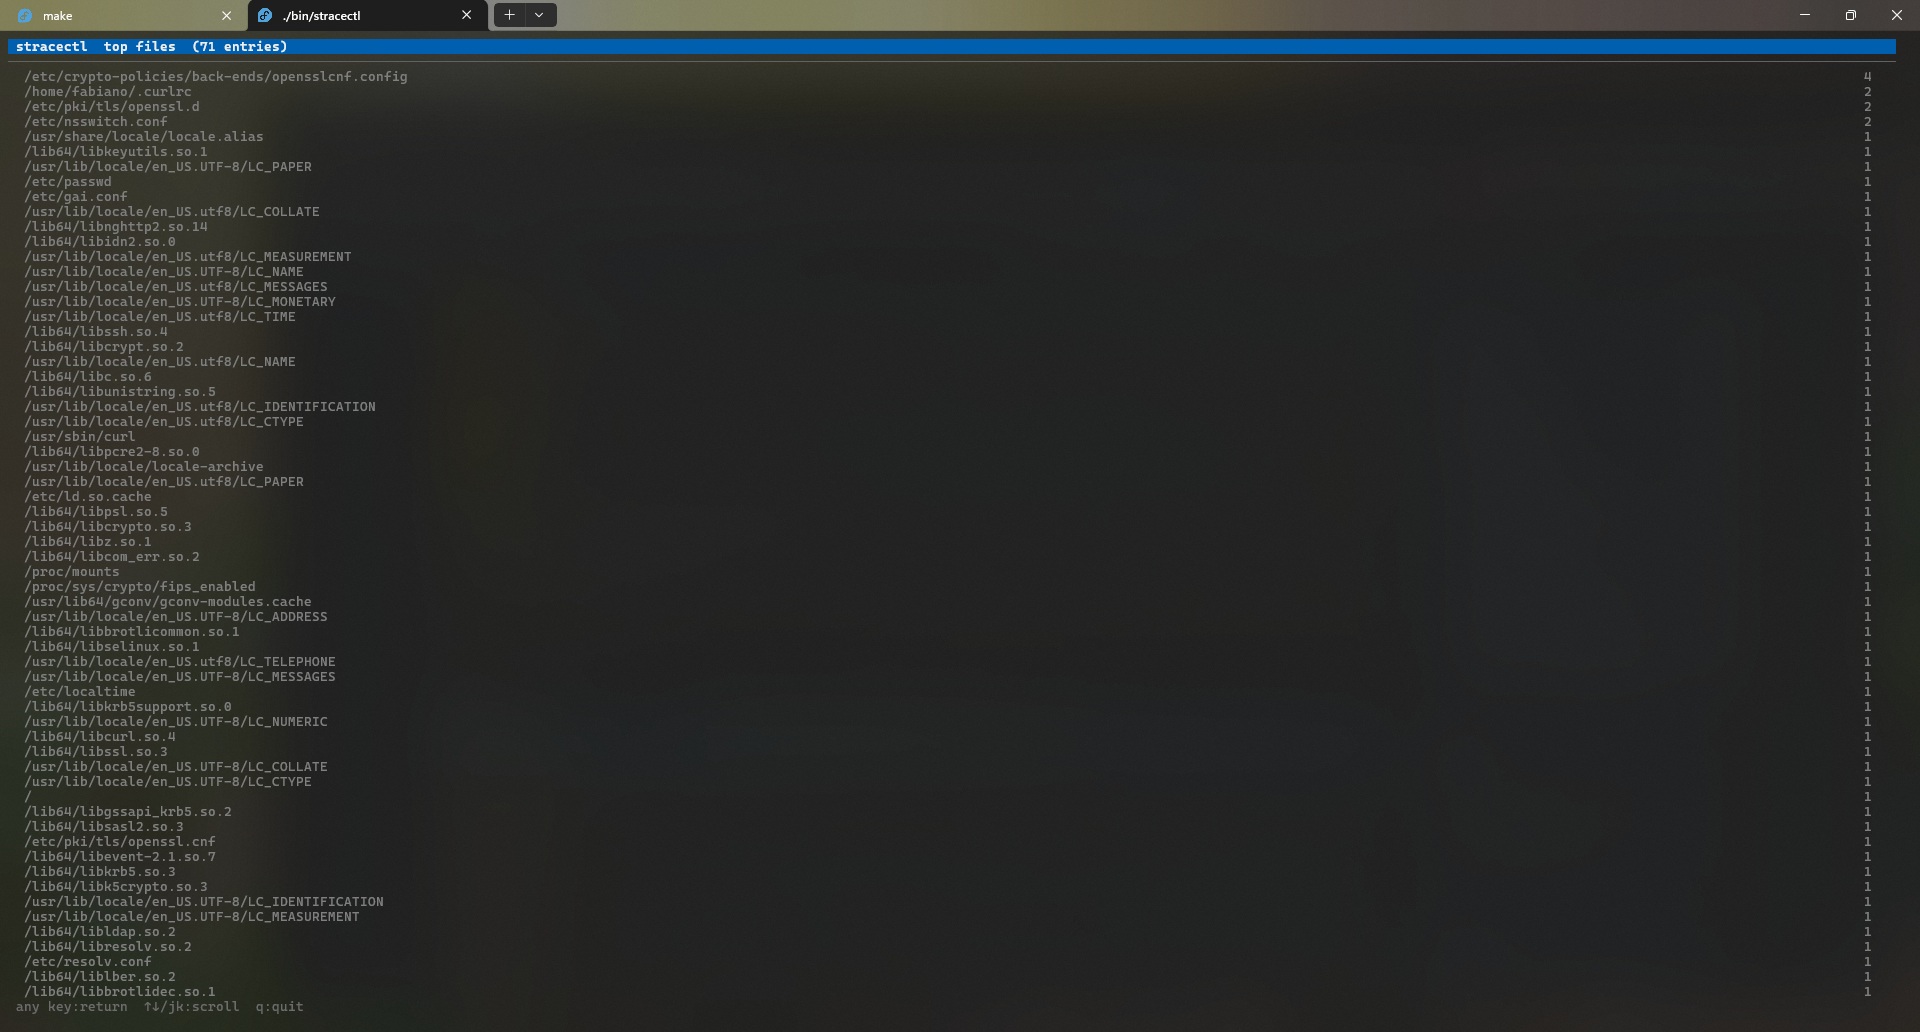
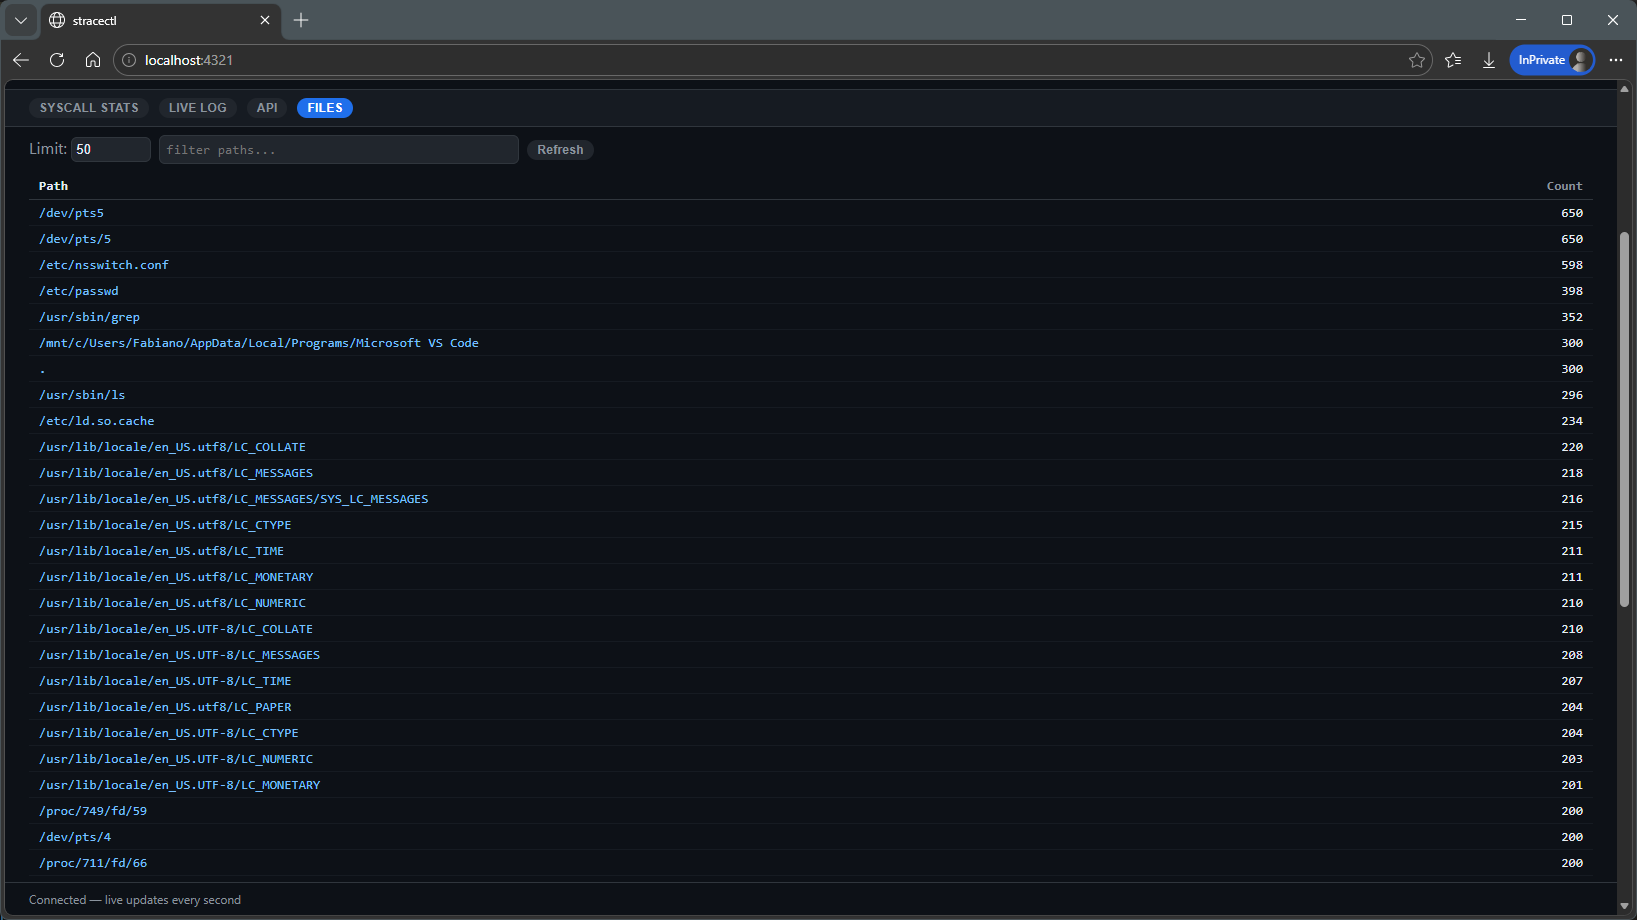
Open files:
Syscall aggregation
Instead of dealing with infinite lines of logs, the project groups calls by type and shows relevant metrics like latency, volume and errors.
This completely changes how you read the output.
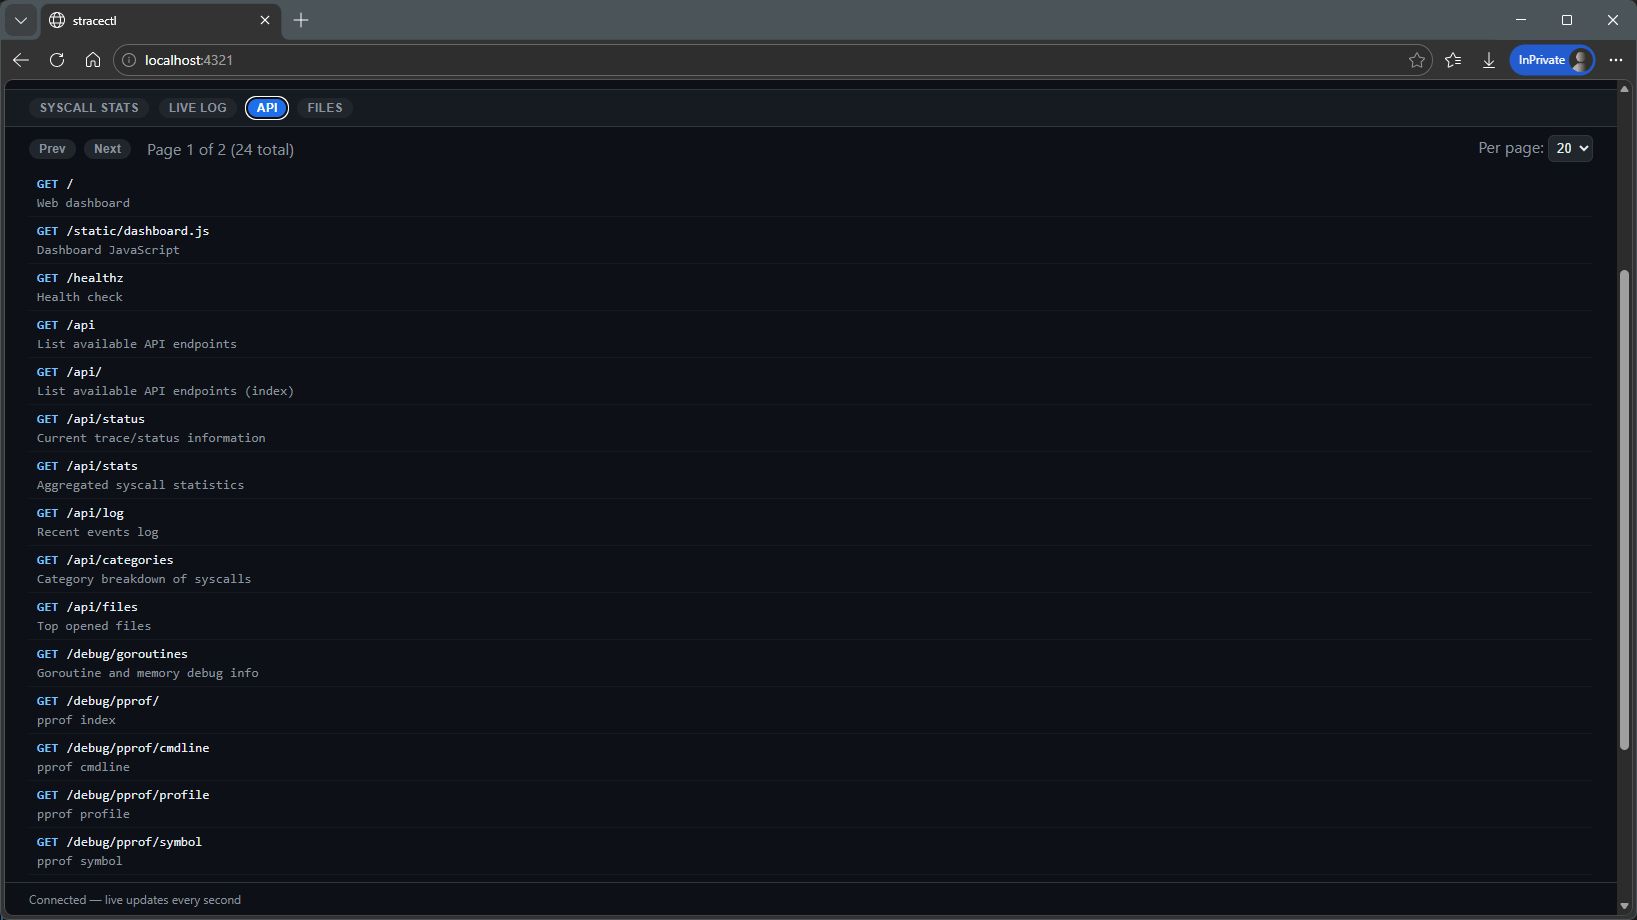
Sidecar mode (HTTP + Web)
stracectl can run as a sidecar and expose data via HTTP.
This includes:
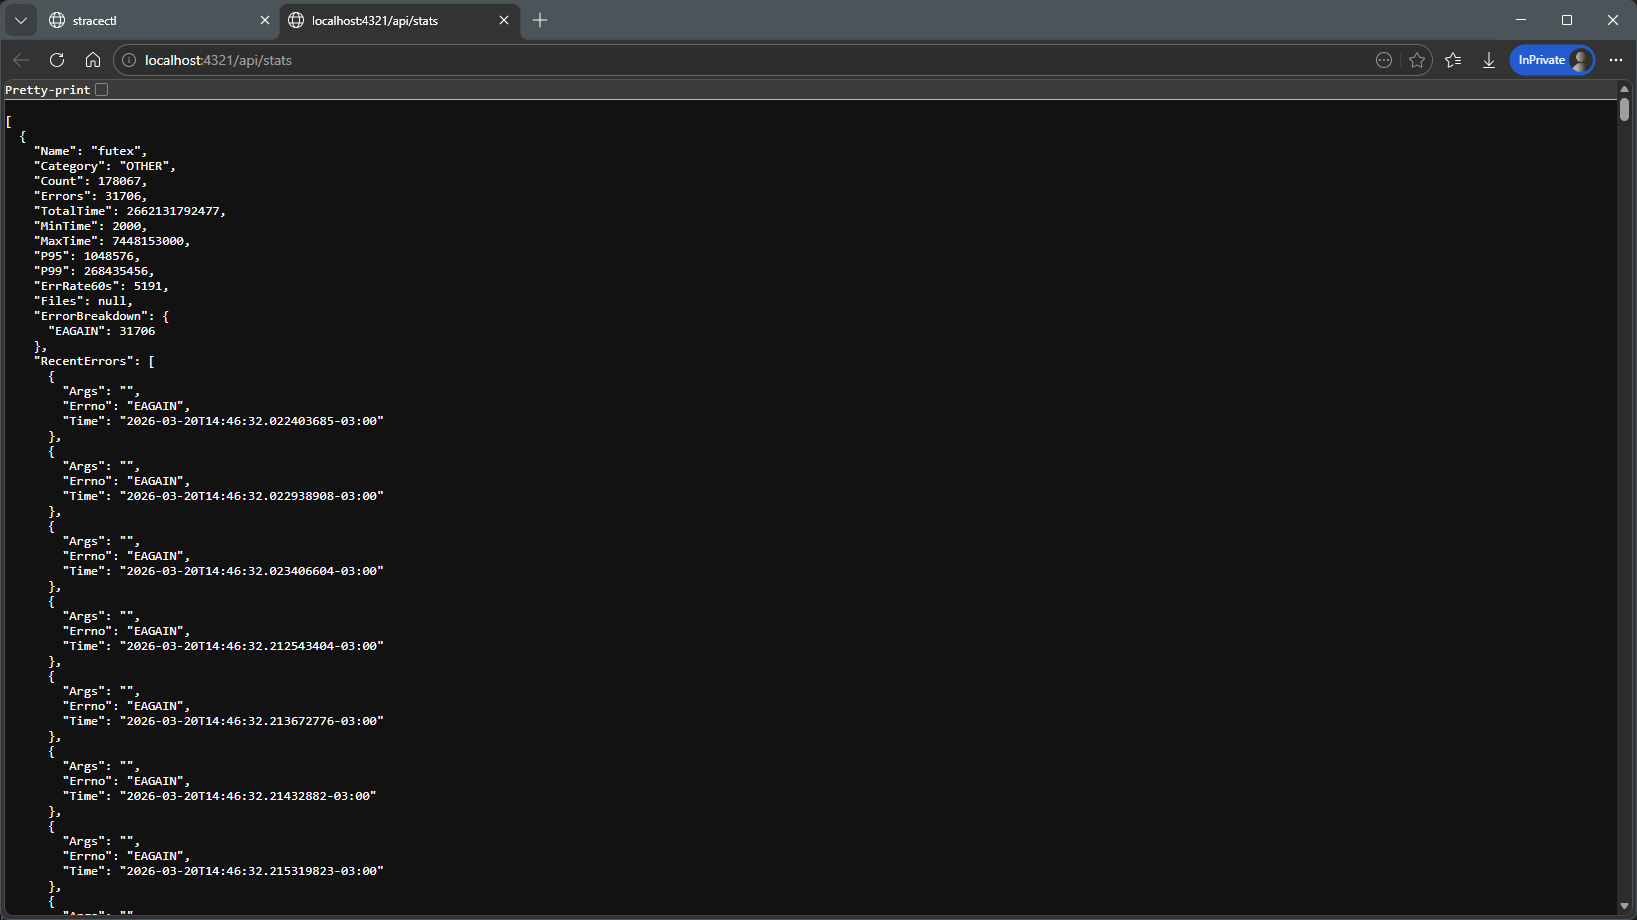
- JSON API
- WebSocket for streaming
- Web dashboard
- Prometheus metrics
Web dashboard
Besides the TUI, there is a web interface that consumes data from sidecar mode.
It makes visualization and sharing analyses easier.
Web dashboard:
Process details:
Live tracing:
API:
Open files:
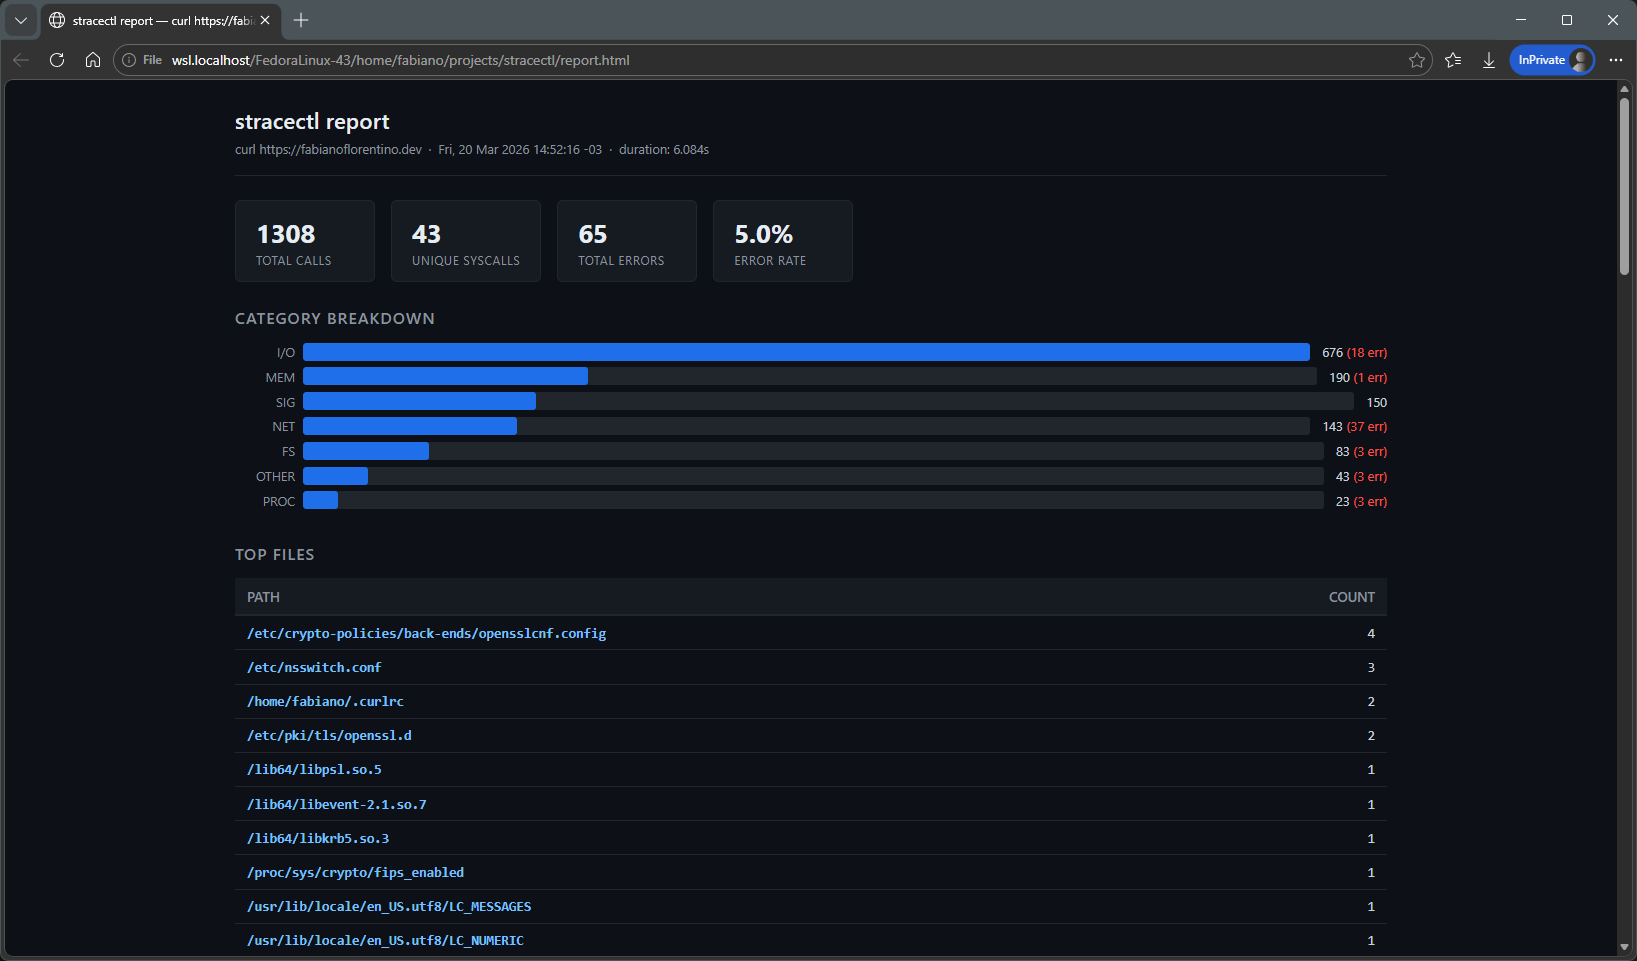
Report / post-mortem analysis
You can take a log generated with strace and replay the analysis later.
This is useful for offline investigations or sharing context.
Report:
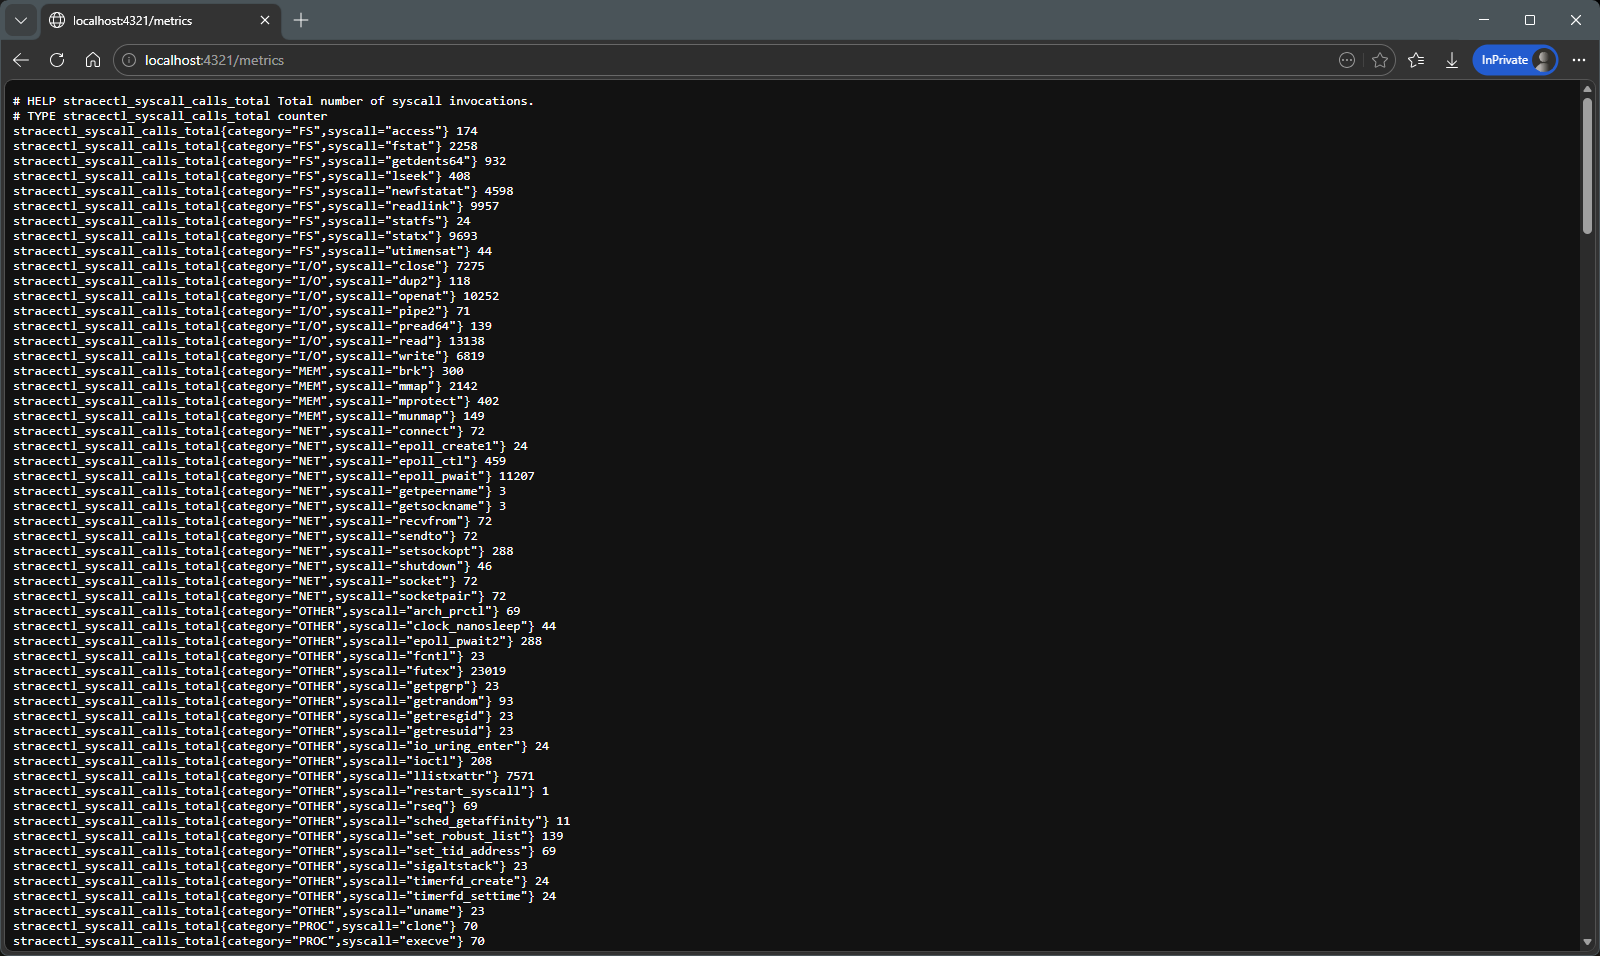
Prometheus metrics
The exposed metrics allow integration with observability tools.
A side note: the idea of using eBPF came from a suggestion by Mateus Prado. I’m participating in his System Design mentorship and asked his opinion about the project — he suggested using eBPF to collect data and rely less on strace. If you’re interested in the mentorship, here’s a tip: System Design Mentorship with Mateus Prado
eBPF-backed backend
Support for eBPF enables collecting data with less overhead in some scenarios.
More than that, it opens doors to better kernel understanding and modern observability.
Sidecar and observability
One of the most interesting points of the project is the sidecar mode. Instead of relying on a terminal, stracectl can expose everything through an HTTP API:
- JSON
- Prometheus metrics
This allows, for example:
- Analyzing a container running in Kubernetes without attaching a terminal
- Integrating with dashboards and observability tools
- Sharing the analysis with others in real time
More than code
One thing that became clear during the process: building the tool isn’t enough.
It was also necessary to:
- Create a site to explain the project
- Write documentation for different scenarios
- Organize usage workflows (live, replay, sidecar, attach)
- Think about the experience of someone who has never used
strace
This turned out to be as important as the code itself. The project is not finished; everything is part of an experiment in learning and building, but the idea is to make it accessible and useful — and that requires creating a good learning experience, not just a tool.
Use cases
In practice, stracectl helps in situations like:
- Diagnosing I/O bottlenecks
- Understanding recurring error patterns (e.g., repeated
ENOENT) - Exploring application behavior at runtime
- Debugging containers less invasively
But perhaps the most interesting use is:
learning how the operating system really works
Conclusion
stracectl started as an attempt to better understand strace. Along the way, it became:
- a model project for how to build a tool from scratch in this AI hype
- a learning laboratory
- and an exercise in building both a tool and the documentation/experience around it
Less about the “perfect tool”… More about making visible something that was always there — but hard to see.
I invite you to visit the project’s website for more details, examples and documentation: https://fabianoflorentino.github.io/stracectl/
And, of course, the code is open on GitHub: https://github.com/fabianoflorentino/stracectl
I look forward to your feedback, suggestions and contributions to make stracectl even more useful and accessible to the community! 🚀